Multi-Building Charts
The BMON system can create reports and charts that display data across multiple buildings. However, each one of these multi-building reports needs to be configured in the Admin interface to the system.
Current Sensor Values Report
The first type of Multi-Building Report that will be discussed is the “Current Sensor Values” report. Here is a sample report that shows the Domestic Hot Water temperatures being delivered to a number of buildings:
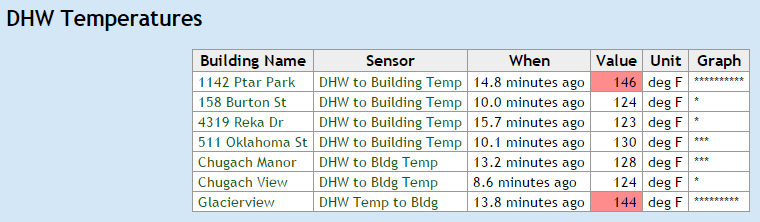
The Value column shows the last value each sensor has reported. Two
of the values are highlighted red because they have values that would
trigger an Alert. The When column indicates how
long ago the sensor reported in. The Graph column presents a simple
graph of the values so it is easier to see where each reading falls
within the range of values presently occurring.
To create this type of report, you first need to write down the Sensor
IDs and the associated Building for each sensor that you want to include
in the report. Log into the Admin interface of BMON as described in
Add Buildings and Sensors, and click on the
Sensors link on the left side of the page. All of the Sensors
currently entered into BMON will be shown. Find the sensors that you
want to include in your report, perhaps using the Filter feature shown
on the right side of the page, which allows you to narrow the
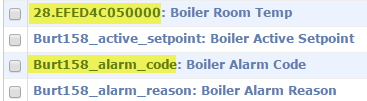
list to a particular building. Once you have found a sensor to include,
write down it’s Sensor ID, which is the text that appears prior to the
colon. Also write down the Building name associated with the Sensor. In
the sample shown below, two different Sensor IDs are highlighted in
yellow: 28.EFED4C050000 and Burt158_alarm_code.
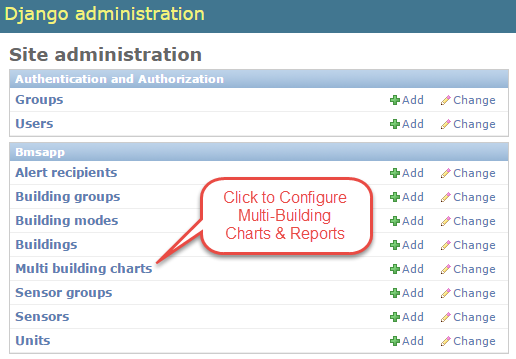
Once you have collected the Building names and Sensor IDs to include in
your report, return to the Admin Home screen by clicking the Home
link in the upper left of the page. Then click the
Multi building charts link as shown below:
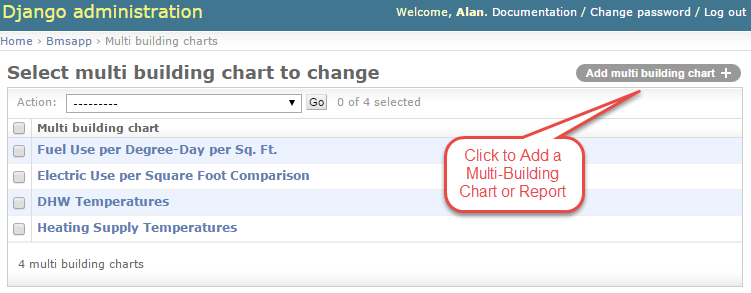
Then click the Add multi building chart button shown below to add a
new Multi-Building report.
Here are the inputs for creating a multi-building Current Sensor Values report:
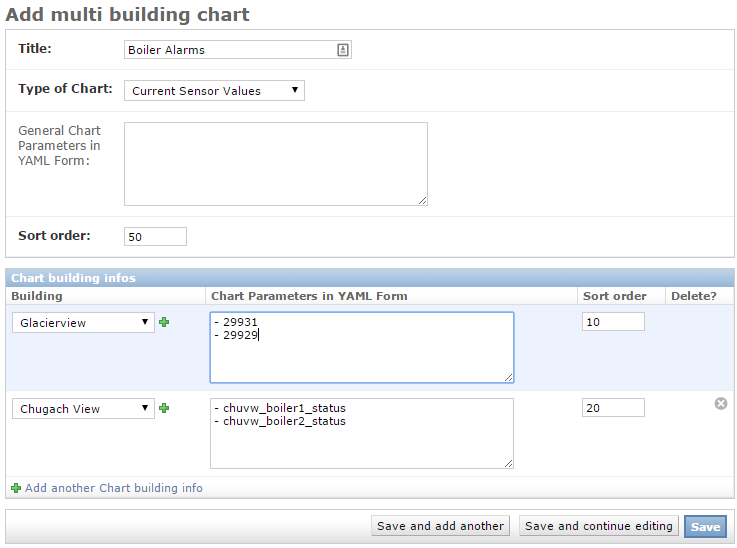
You fill in the Title field with a name for this report. This will
be the name that the User sees when they are selecting the report. From
the Type of Chart dropdown, select
Current Sensor Values. General Chart Parameters in YAML Form is
left blank for this type of report. Sort Order is a number used to
sort all of the multi-building reports. Pick a number that puts this
report in the desired position relative to other multi-building reports.
Counting by 10s with these numbers is recommended so other reports can
be added to the list later.
Next, move on to the Chart building infos section of the inputs. If
you just started creating the report, there will be a blank
Chart building infos item to fill out. You fill out one of these for
each Building that will appear in your report. In the sample shown
above, the Glacierview building was selected from the dropdown as
the first Building to show in report. Next, the large box in the
Chart Parameters in YAML Form needs to be filled out with the Sensor
IDs from the building that you want to appear in the report.
For each sensor you want to include, enter it on a separate line with a
dash and a space preceding it, -. Here is the exact format for two
Sensors having the IDs 29931 and 29929:
- 29931
- 29929
The Sort Order column affects where this building will appear in
the list of buildings that are included in the report.
Once you complete one Building, use the
Add another Chart building info link to bring up another blank form
for the next building to include in your report. Continue this process
until all desired Buildings/Sensors have been entered for the
report. Click the Save button in the lower right corner to complete
the report. It will now be available for Users to view.
Energy/ft2 Chart
This chart allows the User to compare the Energy Use per square foot of building across multiple buildings. Here is a sample chart:
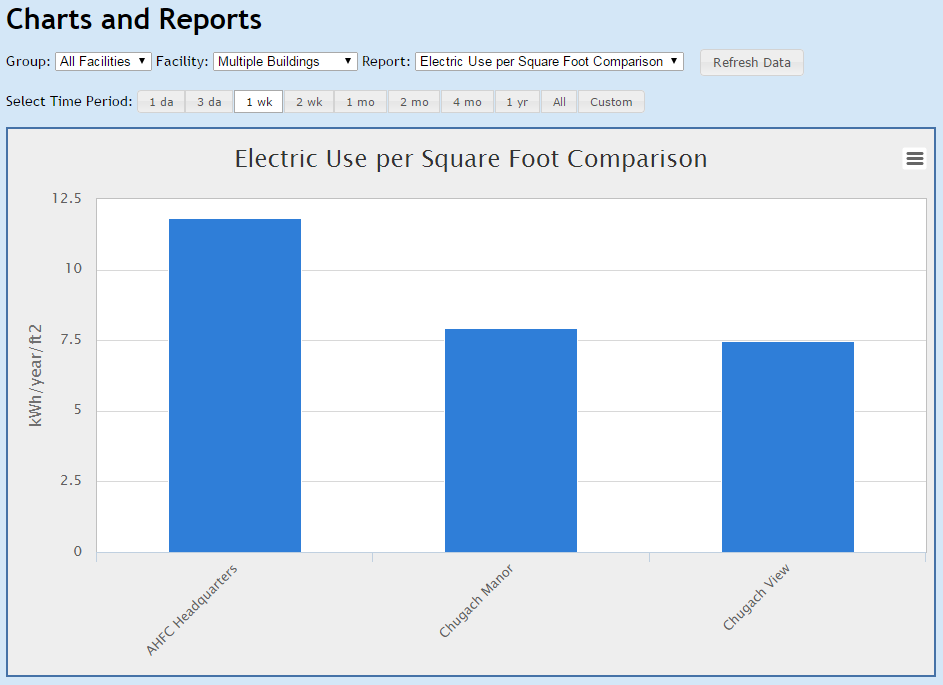
To use this type of chart, each building that you want to include in the chart must have one sensor (it can be a Calculated Field) that measures the rate of energy use you want to compare across buildings. Also, the rate of energy use must be expressed in the same units for each building. In the example chart above, the chart compares electricity use per square foot across three buildings. Each one of buildings has a sensor that measures the rate of electricity use in kW for the building. So, the prerequisites for this chart type are satisfied.
Here are the Multi-Building Chart inputs that created the chart above:
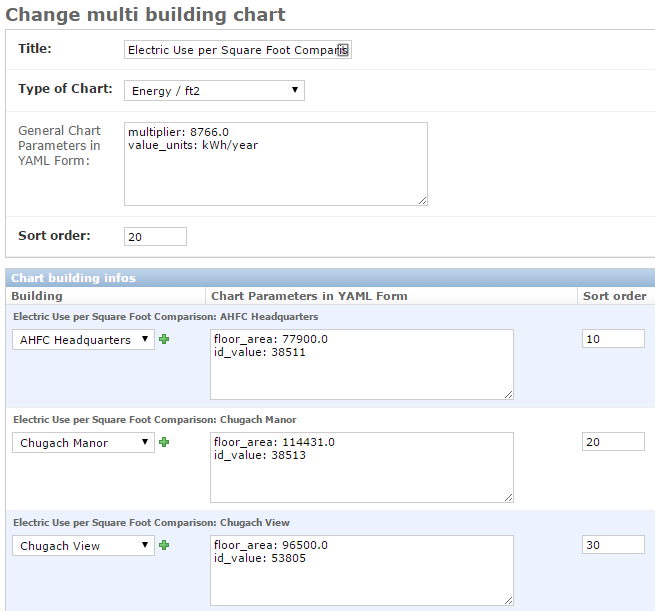
Many inputs have the same meaning as they did in the Current Values
Report, but there some important new inputs. You must select the
Energy/ft2 choice in the Type of Chart dropdown. There are
also two important entries in the
General Chart Parameters in YAML Form box that depend on the units
used for the sensors that are measuring energy use and the total energy
units you want to display on the chart. For this example, the chart will
display energy use in terms of kWh per year. This unit is entered as one
line in the General Chart Parameters box as:
value_units: kWh/year
This entry is only used as part of the label for the vertical axis of
the chart. referring back to the chart image above, you will see that
the vertical axis label is kWh/year/ft2; the /ft2 was added to
the value_units entry to come up with this final chart label.
The other necessary entry into the General Chart Parameters box is
the multiplier entry. In this example a multiplier value of 8766
is entered as:
multiplier: 8766.0
This multiplier value is the amount that you need to multiply the rate
of energy use by in order to calculate the desired energy units given by
value_units. In our example, we explained above that each of the
three buildings has a sensor that measures the rate of electricity in
kW. Since we have decided this chart will display total energy use in
kWh/year, we need to multiply the rate of electricity use in kW by
the hours in a year to arrive at kWh/year of total electricity use.
Thus, the multiplier must be 8766 (average hours in a year including
leap years).
As another example, assume our building sensors measured heating fuel
use and reported it in Btu/hour units. For the multi-building chart to
compare fuel use across buildings, assume that we wish to express total
fuel use in kBtu/year (1,000s of Btus per year). To calculate total
kBtu/year from an average Btu/hour value, you need to multiply by 8766
to arrive at Btus/year and then divide by 1,000 to convert to kBtu. So,
the final multiplier would be 8766/1000 = 8.766. Our value_units
entry would be kBtu/year.
To finish this chart configuration, additional information needs to be
entered for each building that will be compared. In the inputs
screenshot above, you can see that each building has a floor_area
and id_value entry. The floor area entry should be the floor area of
the building in square feet. The id_value entry is the Sensor ID of
the sensor that is measuring energy use in this building (the
instructions above for the Current Sensor Values Report for finding
Sensor IDs apply here as well). The format of the entry is important; there must
be a space after the colon in each line:
floor_area: 77900
id_value: 38511
Energy/Degree-Day/ft2 Chart
The Energy/Degree-Day/ft2 chart compares energy use across
buildings normalized for both the size of the building and the number of
heating degree-days experienced by the building. This allows better
comparisons of buildings of varying sizes located in different climates.
Here is an example of the chart:
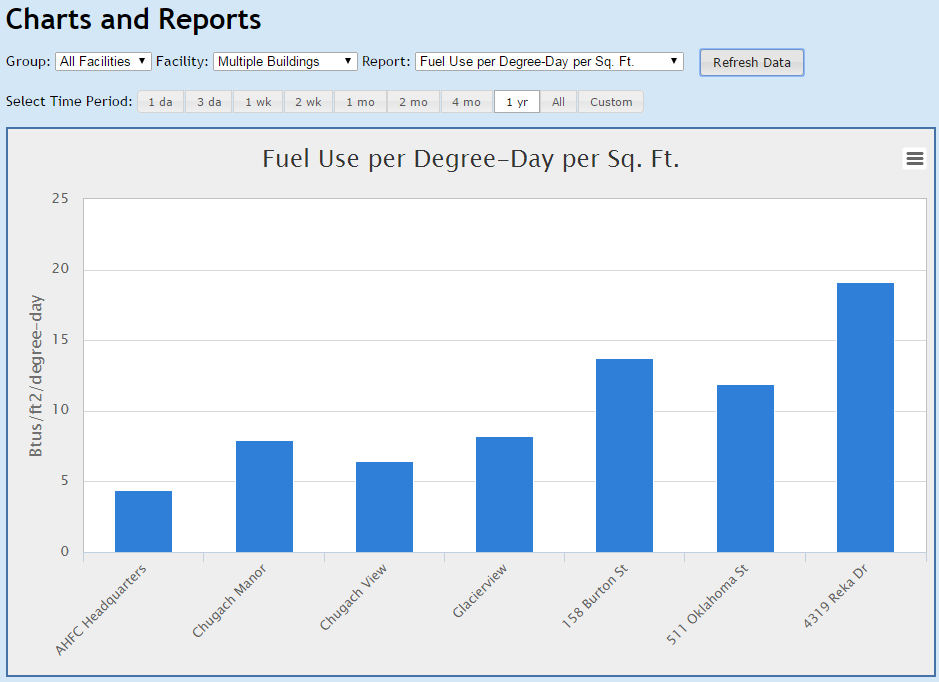
As before with the Energy/ft2 chart, each building that you want
to include in the chart must have one sensor (it can be a Calculated Field)
that measures the rate of energy use
you want to compare across buildings. Also, the rate of energy use must
be expressed in the same units for each building. Finally, there must be
an outdoor temperature sensor available for each building in the chart.
These “sensors” can be weather stations accessible over the Internet,
as explained in Calculated Fields.
Here are the main inputs and the inputs for the first two buildings that are present in the above chart:
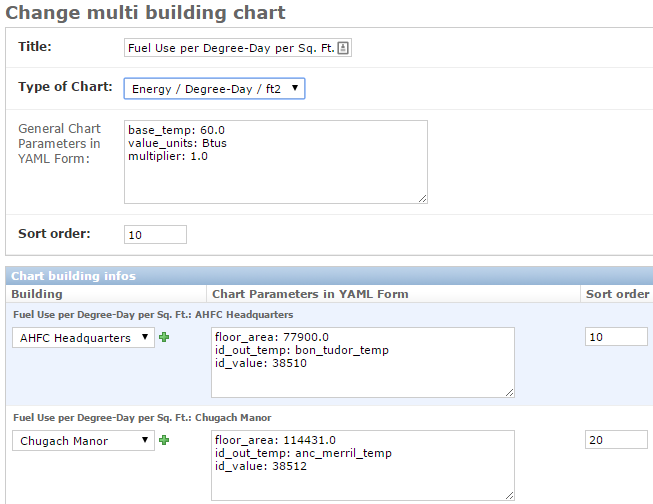
From the Type of Chart dropdown, Energy/Degree-Day/f2 is
selected. There are three important inputs in the
General Chart Parameters box. The base_temp input allows you to
specify the base temperature used when calculating heating degree days.
Choosing a base temperature near the “balance point” of the buildings is
best; the balance point is the outdoor temperature above which no heat
is typically needed in the building. 65 degrees F is the most typical
base temperature, but in this chart 60 degrees F is used because these
buildings typically do not need heat until outdoor temperatures drop
below 60 F.
value_units specifies the Energy units that you want to use in the
chart. In this example, Btus are entered, so the chart vertical axis
will be Btus/ft2/degree-day. Finally, the multiplier input can
be specified (it defaults to 1.0 if not provided). As stated above,
every building must have a sensor that reports the rate of energy use
using units that are consistent across all the buildings. The
multiplier converts the rate of energy use into the amount of energy
consumed in one hour expressed in value_units. As an example, assume
the sensors report in Btu/hour and the value_units are Btus. The
multiplier in this case is 1.0; if the rate of energy use is 100,000
Btu/hour there will be 100,000 Btus used in one hour. If value_units
were kBtu (1,000s of Btus), the multiplier would need to be 0.001, since
a rate of use of 100,000 Btu/hour would use 100 kBtus in one hour.
For each building that is presented in the chart, three different
Chart Parameter inputs are required. As in the prior chart, a
floor_area input giving the building floor area in square feet is
required. Also similar to the prior chart, an id_value input is
needed to provide the Sensor ID of the sensor that measures the rate of
energy use for the building. The new input for this chart type is
id_out_temp. For this input you need to supply the Sensor ID of an
outdoor temperature sensor that is appropriate for the building. For the
example above, the outdoor temperature sensor for the
AHFC Headquarters building is bon_tudor_temp. This is a Weather
Underground weather station that was setup as a Calculated Field.
For the Chugach Manor building, the
outdoor temperature sensor has the Senor ID of anc_merril_temp,
which comes from the Merril Field, Anchorage, Alaska National Weather
Service site.
After entering information for each of the buildings to be presented in
the chart, click Save in the lower right corner, and the chart will
be available to users.