Add Buildings and Sensors
To start using the BMON system, Sensors and Buildings must be added to the system. A Sample building and a Sample sensor were added to BMON when it was installed on the web server. This document will show how to add your actual buildings and sensors to the system.
The sample building and sensor can be deleted once at least one actual building and sensor are added to the system.
Logging into BMON’s Admin Interface
Adding sensors and the general configuration of BMON occurs through the
Admin interface. To access the Admin interface, navigate to
<site URL>/admin/ in your browser; for the AHFC BMON system, that
URL is https://bms.ahfc.us/admin/. Once there, you will be presented
with a Log In page. During installation of BMON on the web server, a
super user account was created; that username and password can be used
to initially log into the system. After logging in as the superuser,
you can create additional Users that can access the Admin interface,
each with a different username, password, and editing privileges. These
new Users are created in the Users section of the Admin interface.
Adding a Building
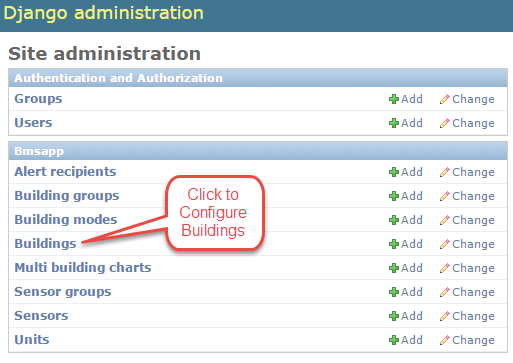
Once logged in, the following screen should appear; click the Buildings link as shown below to access the part of the Admin interface that allows you to configure buildings.
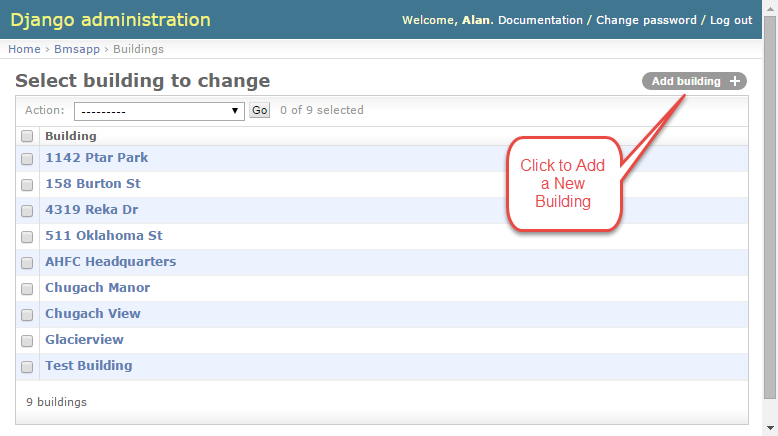
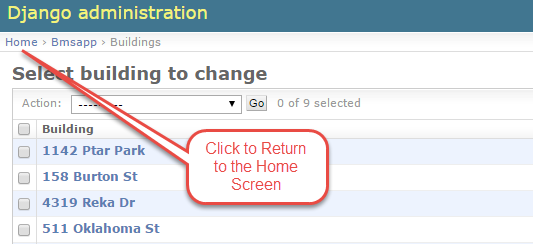
Once in the Buildings section of the Admin interface, you will see the list of buildings that have already been entered into the system. If the system is new, only the Sample Building will be shown. In the screenshot below, a number of buildings have already been configured. As the image shows, click the Add building button to add another building.
An Add building page will appear, the top portion of the page contains the essential inputs for adding a new building:
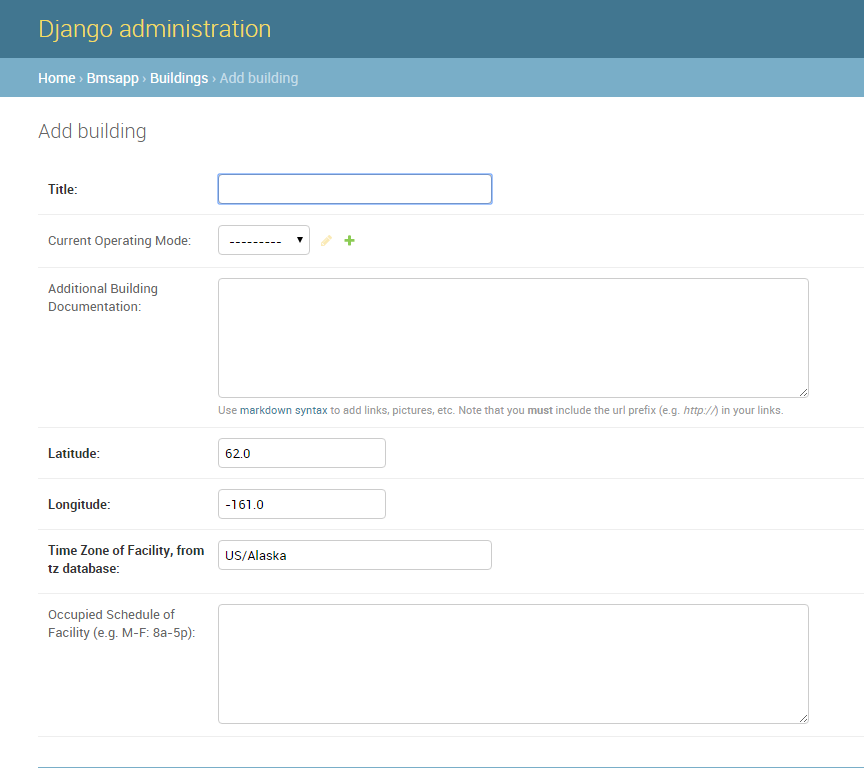
Here are the inputs for entering a new building:
Title: Enter the name of this building as you want it to appear in all of the reports and graphs.
Current Operating Mode: (Optional) This input indicates the current operating mode of the building. The input is only used when evaluating Sensor Alerts, which are discussed elsewhere. Until you start using Sensor Alerts, you can leave this input at its default value, ‘——‘.
Additional Building Documentation: (Optional) This input allows for images, links, and other additional building-wide notes to be entered using Markdown syntax. These images, links, or notes will be displayed at the bottom of the page on the Current Sensor Values report as well as the Dashboard report, if configured.
There are many great resources online for learning to use Markdown syntax, including this tutorial. The two most important features for building documentation are adding in web-links and links to images.
To add a web link, simply type in:
[link text](http://www.enter_your_web_link_here.com)
Note that you must include the url prefix (e.g. http://) in your links.
Adding a link to a picture is similar, but with an added exclamation point before the link syntax:

If your documents and images aren’t already hosted somewhere on the web, google drive offers an easy and free way to host things online. First, if you don’t already have an account, you will need to create one. Then, you will need to upload the pictures or documents to google drive. Lastly, you will need to make the link public, share it, and paste it to gdurl.com as detailed in this 1-minute how-to video
Latitude and Longitude: The BMON system includes the ability to show monitored buildings on a Map. Enter the Latitude and Longitude of the building, in decimal format, so it is properly placed on the map. You can determine the lat/lon of a building from Google Maps using these instructions.
Time Zone of Facility: Enter the timezone where the building is located, for example “US/Alaska”. The list of valid time zones comes from the Olson Timezone database and is available here.
Occupied Schedule of Facility: (Optional) Some buildings are not occupied 24/7. A number of the BMON graphs and reports highlight sensor values during the occupied periods of the building. If this building is not continually occupied, enter its occupied schedule here. Here is an example of how you would enter the schedule of a building that is occupied 8a - 5p on Mon - Fri and Noon - 4p on Saturday:
M-F: 8a-5p
Sa: 12p-4p
Here is a more complicated schedule:
M-F: 8a-5p
Tu, Th : 6:30p - 7p, 8p - 9:45p
The input allows for multiple lines of entry, each line being a
different set of occupied periods. Days are separated from time ranges
with a colon. Days can be abbreviated or spelled out. Day ranges like
Mon-Fri are valid, or individual days can be separated by commas,
like M, W, F. Start and end times are separated by a -, and
multiple time ranges can be separated by a comma as shown in the prior
example.
Annotations for events in the building’s timeline: (Optional) If significant changes have occurred in a building’s timeline (i.e. energy retrofits, additions, changes to mechanical system, etc.), this input gives you the ability to annotate those dates on the BMON timeseries charts. The input allows for multiple lines of entry, with each line representing an event that will show up on the timeseries. On each line, enter the text that will be displayed on the chart followed by a colon followed by the date where the annotation will appear. The date can include also include a time of day if desired.
Here is a sample entry:
Roof Insulation Retrofit: 6/12/2016
Boiler Replaced: 1/1/2017 3:45 PM
There are a couple more Input sections beyond these essential inputs. The one labeled “Bldg to sensors” is used to associate particular sensors with this building. These inputs will be discussed in the Adding Sensors section below. Another input section is “Dashboard items”. These inputs will be discussed in the Creating a Dashboard document.
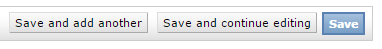
After completing the essential inputs discussed above, Save the new
building by clicking either the Save button or the
Save and add another button (if you want to add another building).
These buttons are found in the lower right corner of the screen and look
like:
Building Groups
You can organize Buildings into Groups. Users can filter the list of buildings that they are analyzing down to a particular Building Group. A Building Group could represent a geographical region or a group of buildings that are the responsibility of a particular staff member. There are no restrictions on the meaning of each Building Group, and any one Building can be a member of multiple different groups.
It is not necessary to set up any Building Groups. If this feature is not of interest, skip to the next section titled Adding Sensors.
To set up a Building Group, you need to go to the main Admin Screen. If
you just finished adding a building, you return to the Home screen of
the Admin interface by clicking the Home link in the upper left
corner:
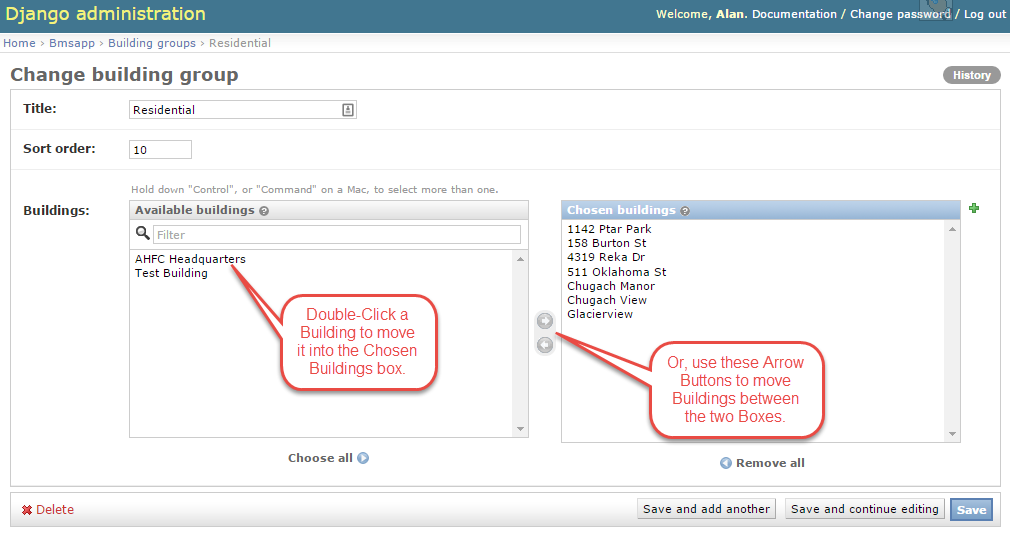
Then, on the Home screen click the Building groups link in the
left-hand column. In the upper right corner of the next screen, click
the Add building group button. The Building Group editing screen is
shown. Below is a screenshot after a Building Group titled
Residential has been set up. There are 7 buildings shown in the
right hand box that are in the Residential group; the two buildings
on the left are not in the group.
Adding Sensors
This section describes how to add sensors into the BMON system. If you
just finished adding a building, you first need to return to the Home
screen of the Admin interface by clicking the Home link in the upper
left corner:
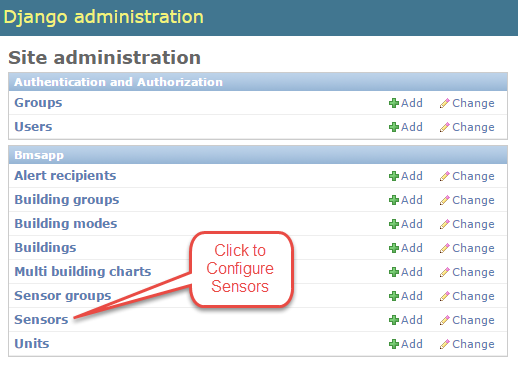
Once back to the main Home screen, click the Sensors link to add or
edit sensors:
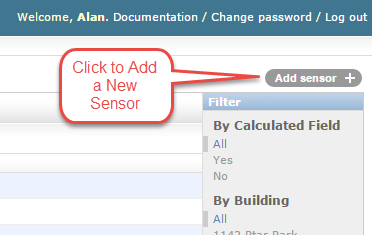
And then to add a new Sensor, click the Add sensor button in the upper right:
Here are the key inputs for configuring a new sensor:
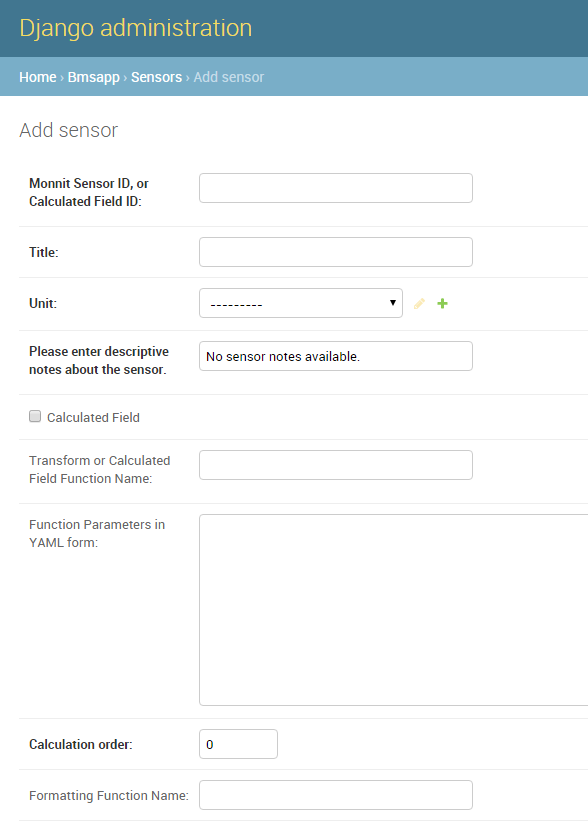
Monnit Sensor ID, or Calculate Field ID: Each sensor that posts its data to the BMON system needs to have a unique ID, which is entered here. For Monnit wireless sensors, the ID is the Monnit Sensor ID found on the label attached to the sensor:
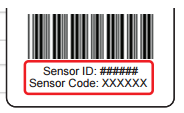
An example of a Monnit Sensor ID is 29938. If the sensor is a 1-Wire
temperature sensor attached to a Mini-Monitor, the ID is the 1-Wire
ID for the sensor, such as 28.7CED4B050000. If this “sensor” is
actually a calculated field or a value retrieved from an Internet
weather service, you must create an ID that is not in use by any other
sensor. The ID can contain numbers and letters and cannot be more than
30 characters long. An example of such as ID is anc_merril_temp
(Anchorage Merril Field temperature).
Title: The Title input is the descriptive name of the sensor and is
the name displayed to users of the system. An example is
Boiler Supply Temp. The Title must be 50 characters or less. You do
not need to include the building name in the Title, as that will be
displayed separately.
Unit: Select the units for this sensor’s values, such as
temperature: deg F. A number of different Unit types are available,
but you can easily add others by clicking the green plus symbol to the
right of the dropdown box. When adding a new Unit, you are asked for the
Unit Label (deg F in the above example) and the Measurement Type
(temperature in the above example). Any Units you add will be
permanently available for other sensors.
Please enter descriptive notes about the sensor: This section allows descriptive notes to be added for each sensor. These notes will be shown to the user on the Current Sensor Values page when the mouse hovers over the sensor, as shown below.
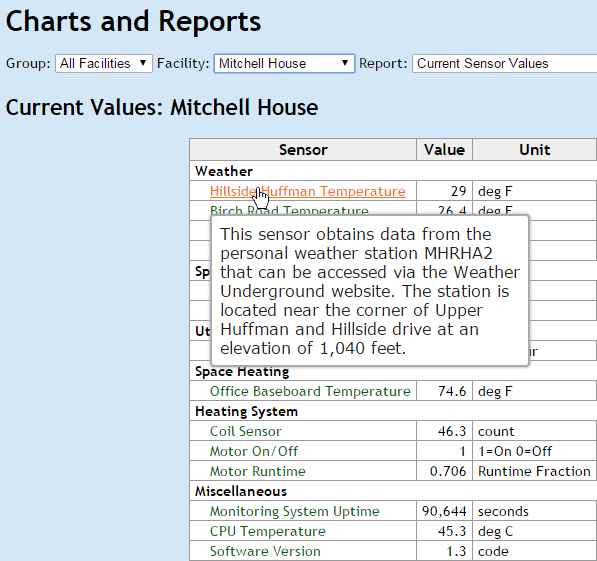
This section should be used to give additional information to the user, such as the specific location of the sensor, the type of sensor, and any details about the measurements. The default text that will be shown to the user if nothing is entered in this field is “No sensor notes available.”
Calculated Field: For a sensor that is posting values to the BMON system, this checkbox should not be checked. If the “sensor” you are adding is actually calculated from other sensor values or is acquired from the Internet, then this box should be checked and you should refer to the Calculated Fields document for information on how to create Calculated Fields.
Transform or Calculated Field Function Name: If the value that is
posted by the sensor needs to be converted to a different value before
being stored and displayed to the user, this input needs to be filled
in. The simplest way of using this input is to type in a math expression
that performs the conversion. Use the variable val to represent the
sensor’s raw value before conversion. For example, if the sensor posts
in degrees C and you want to convert to degrees F, you would use the
following conversion expression:
1.8 * val + 32
As another example, let’s say that you know that a temperature sensor is reading 1.5 degrees too high. You can use a conversion expression to correct the reading:
val - 1.5
There are more complicated uses of this input. For example pulse counter
sensor values can be converted to engineering units like kW or
Btu/hr through use of a Transform Expression. Read about these
uses here. This input is also used for
Calculated Fields.
Function Parameters in YAML form: For the more sophisticated uses of Transform Expressions and Calculated Fields, extra information is sometimes needed and is entered here. Refer to those documents for more information. For simple sensors, this input should be left blank.
Calculation order: This input is used with Calculated Fields and affects which calculations are done first. For normal sensors or calculated fields where calculation order does not matter, the default value of 0 should be used.
Formatting Function Name: Sensors always report their values as numbers. Sometimes these numbers really represent a state that is better displayed as a word or phrase. For example, the alarm contacts on a Boiler will report a value of 1 when the Boiler has alarmed or gone off line and will report a 0 when the boiler is functioning properly. It is more informative to see those values as “Alarm” and “OK”. This input can be used to provide this formatting. There are number of functions available to convert reported values into more readable phrases. Some of the most commonly used ones are:
``alarm_formatter``: Displays a 0 as
OKand anything else asAlarm. To use this function, simply typealarm_formatterinto theFormatting Function Nameinput box.``on_off_formatter``: Converts a 0 into
Offand a 1 toOn. Typeon_off_formatterinto theFormatting Function Nameinput box to use this formatting function.``occupied_formatter``: To be used with occupancy sensors. Converts a 0 from the sensor to
Vacantand a 1 toOccupiedThere are a number of special status codes reported by the Burnham Alpine Boilers and the AERCO boilers, which are monitored by the Mini-Monitor setups. These status codes have special formatting functions that are described in the Mini-Monitor documentation.
Once these key inputs have been filled out for the Sensor, you can associate the sensor with a Building (or multiple buildings). To do this, you use the inputs that appear just below those described above:
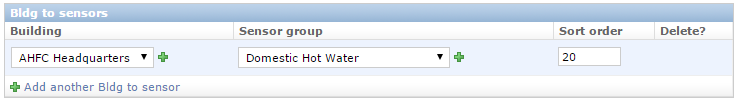
First, select the Building from the dropdown box (AHFC Headquarters
in the example above). Next, users see sensors grouped into categories
for a more organized display. Choose a Sensor Group from the dropdown
(Domestic Hot Water in the example above). If an appropriate Sensor
Group is not available, you can add one by clicking the green plus
symbol to the right of the dropdown; just supply a Title for the new
Sensor Group and a Sort Order value that will be used to order your
new Sensor Group relative to the other groups used for this building.
Finally, enter a Sort order for this sensor, which will be used to
order the sensor within the Sensor Group. Leaving space between your
Sort order values (e.g. 10, 20, 30, etc.) makes sense so a future sensor
can be fit in between existing sensors.
In some situations, it makes sense to associate a Sensor with multiple
buildings. An example would be an outdoor temperature sensor that is
near to multiple buildings. Seeing the temperature value when viewing
each building is useful. To associate the Sensor with another building,
click the Add another Bldg to sensor link that you see at the bottom
of the image above. An additional row of inputs will appear allowing you
add another building association.
Note that you also can set up associations between Sensors and Buildings by going to the Edit screen for a particular building, and midway down that screen is an area where sensors can be selected and associated with the Building. Linking Sensors and Buildings can be done either on the Sensor edit screen or the Building edit screen; they are equivalent.
Below the Bldg to Sensors inputs are inputs related to Sensor Alerts.
Please see the Sensor Alerts document to learn how to
setup notifications that will be sent out via Text or Email if this
sensor reads outside of a normal range of values.
To Save the input values you have just entered for this Sensor, click one of the Save buttons at the bottom right of the screen:
Filtering the List of Sensors
The full sensor list for the BMON system can become quite long, making it difficult to find a particular sensor to edit. However, a Filter feature is available to improve this situation. When you are on the main Sensor screen, there is a Filter box present at the right side of the screen:
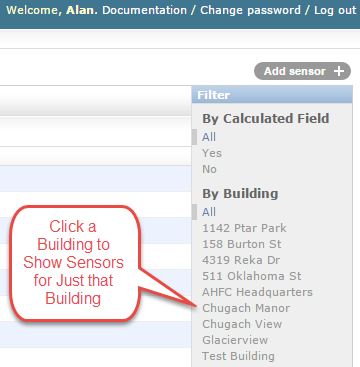
By clicking on one of the Building names, you will filter the Sensor list down to just sensors associated with that building. There is also a Filter available to just show Calculated Fields or non-Calculated sensors.
Deleting Sensors, Building Associations, and Alerts
If you want to delete one or more sensors from the system, you can do so from the main Sensor screen:
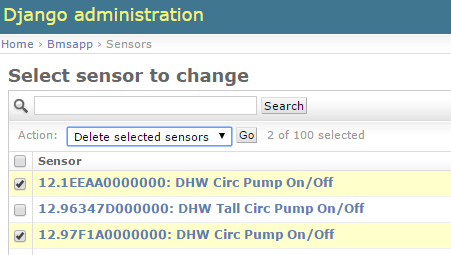
Check the boxes next to the sensors to be deleted, select
Delete selected sensors from the Action dropdown, and then click
the Go button.
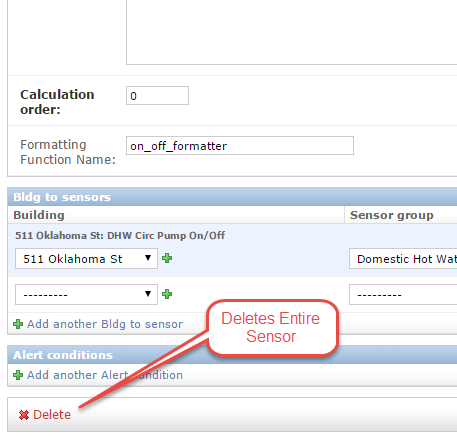
You can also delete an entire sensor while you are on the Editing
screen for that sensor. Click the Delete button in the lower left
corner of the screen:
When you need to delete an association that you have set up between a Sensor and a Building, you need to go to the edit screen for the Sensor and perform the following steps:
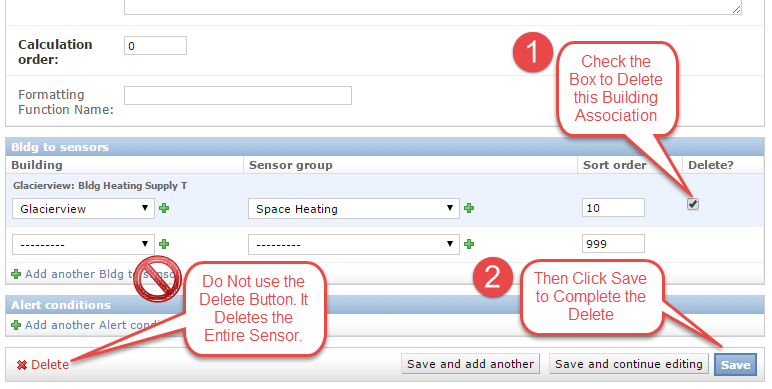
Click the checkbox to delete the building association
Click save
Do not use the red Delete button in the lower left corner of the screen as that will delete the entire sensor, not just the association between the sensor and the building. This same general approach is used when deleting other list items like Alerts–check the Delete box for the Alert, and then click the Save button for the Sensor.