Integrating with Siemens Building Management Systems
This document describes how to create data files (CSV) in the Siemens Building Management System for integration into the BMON system. The specific steps shown here are specific to the Siemens Insight APOGEE Building Automation Software Program version 3.7.0 (2005). The general goals of each step of the report building process are described here to assist in integrating your Siemens Building Data with BMON. See General Method for Gathering Data from Building Automation Systems for one approach to pushing this data into BMON.
* A few notes on Siemens-specific terminology used in this document.
Pointrefers to a sensor or data point.Trendrefers to a collection of points and their values over time.
Configure Sampling Rates for Each Sensor
The first step to automatically exporting data from a Siemens system to BMONs web-based monitoring tool is to select the sensors you would like to export, configure them to the correct time interval, and ensure that they are available for collection.
On the computer running the Siemens program open the Trend Definition Editor

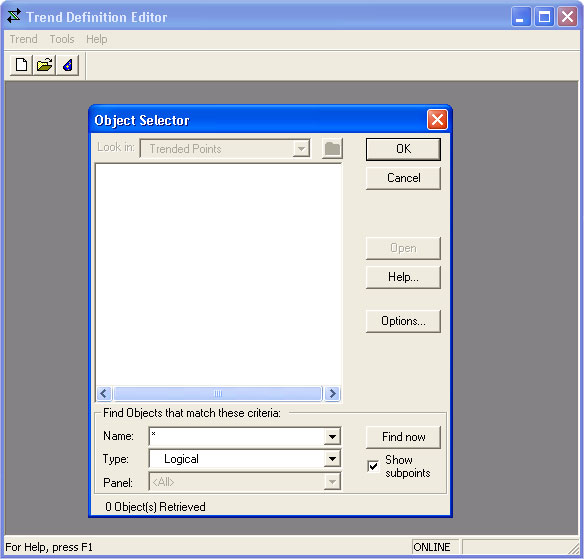
From the Trend menu, select Open and use the object selector to find the data sensor (referred to as points) you
want to monitor. Use the asterisk wildcard * to have the object selector list all potential points in the system.
If you already know the names of the points you would like to add you can also use the wildcard to narrow down your
results. For instance, to locate all points with “boiler” in their name use the following format: *boiler*
note that the wildcard should be added on both sides of the term unless you know the name starts with the term (format term*)
or ends with the term (*term) otherwise your search will yield no results.
Select a point by double clicking on it and define your parameters - depending on the sensor you will have a number of options which may include COV (change of value), Interval (time-based sample), and wizard (user assistance tool). For the purposes of integrating with BMON systems, we will focus on the Interval option.
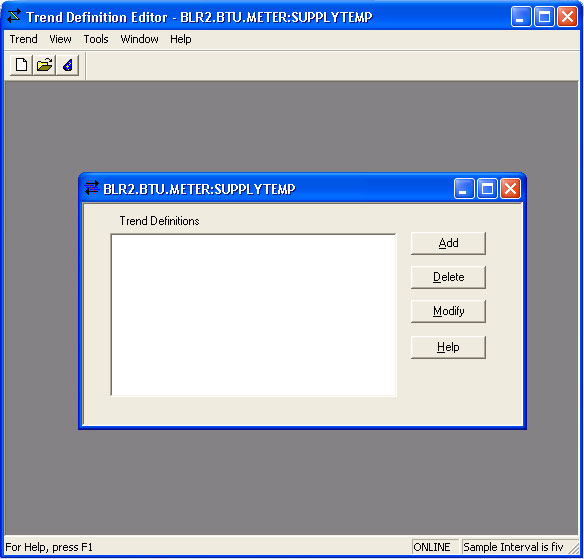
Click add.
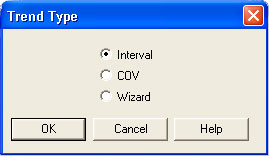
Select Interval and click OK
Select a sampling interval, and make sure Enable PC Collection is checked.
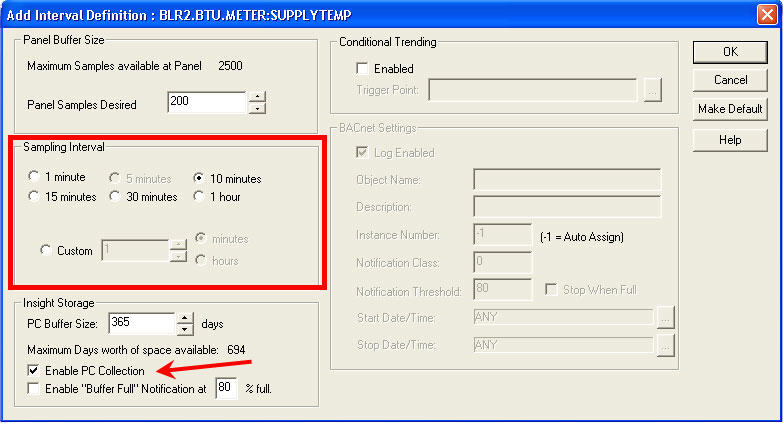
While not specified above, Panel Samples Desired and PC Buffer Size may need to be adjusted based on the interval you select.
Panel Samples Desired refers to the number of samples taken per interval, while PC Buffer Size indicates the number of days
worth of space the computer is available to hold. If adjusting these variables, take note of the Maximum Samples available at Panel
as this indicates the maximum number of samples that can be collected per interval.
Build the Trend Collection Report
In order to build a report, data must first be retrieved from the Siemens field panel and saved to the computer. This is done by creating a Trend Collection Report.
Open the Report Builder

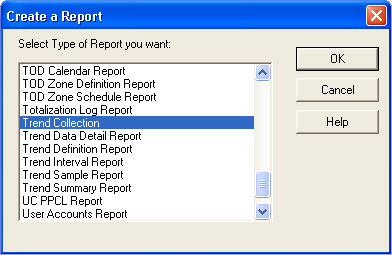
From the Definition menu, select New
Select Trend Collection Report
Click Add and select the points you configured in the previous section
Save the report by clicking the Definition menu and selecting Save.
To verify your report is functioning correctly, run a test report by selecting Run Report from the Definition menu.
Build the Trend Interval Report
Once the system has been configured to obtain data from the Siemens field panel using the Trend Collection Report, the data can be extracted and written to a CSV file.
Open the Report Builder
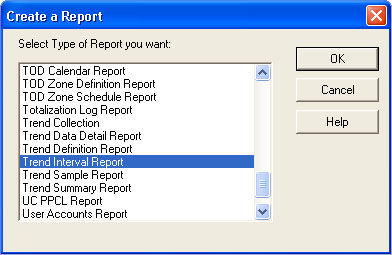
From the Definition menu, select New
Select Trend Interval Report
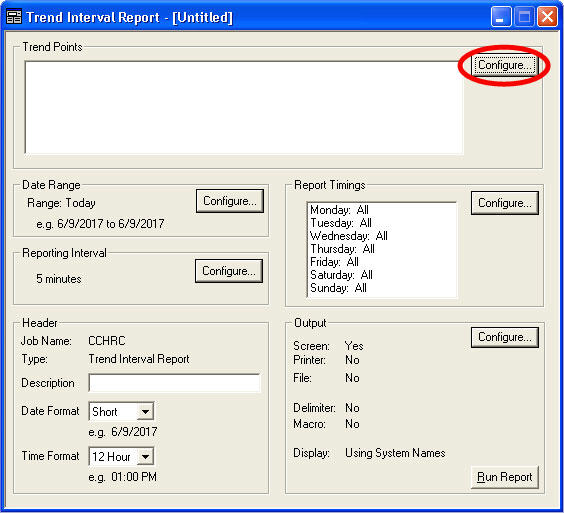
Configure your Trend Points by clicking Configure
Click Add and select the points you configured in the previous section
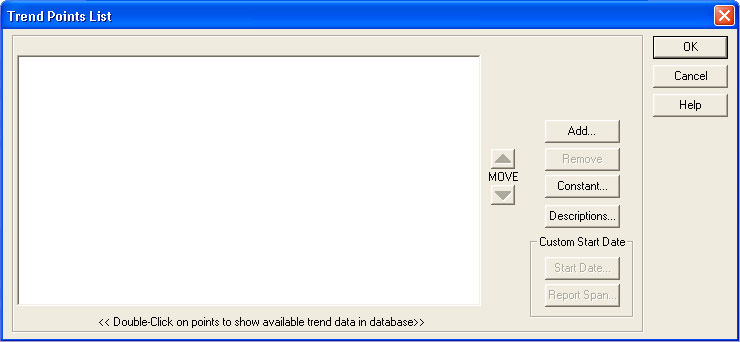
After you’ve added your points to the trend points list click OK
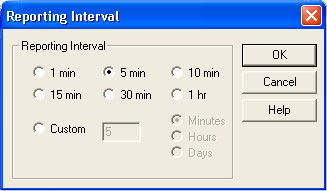
Configure the Reporting Interval by clicking the Configure option and selecting your preferred interval
Configure the Output by clicking the Configure option
Click the ellipses … next to File and browse to the location you wish to save your file, if you are using Dropbox to store your files for access from the BMON system you will want to select a location inside your Dropbox folder. Give the file a descriptive name and confirm that System Date and Time is checked.
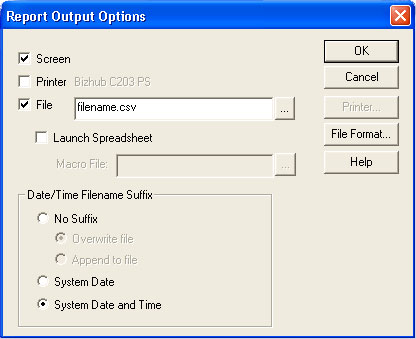
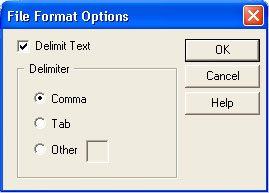
Then click File Format... and select Delimit Text and Comma.
Click OK until you are back to the Trend Interval Report screen and check that the time format is 24 hours. Your report should now look similar to the example below:
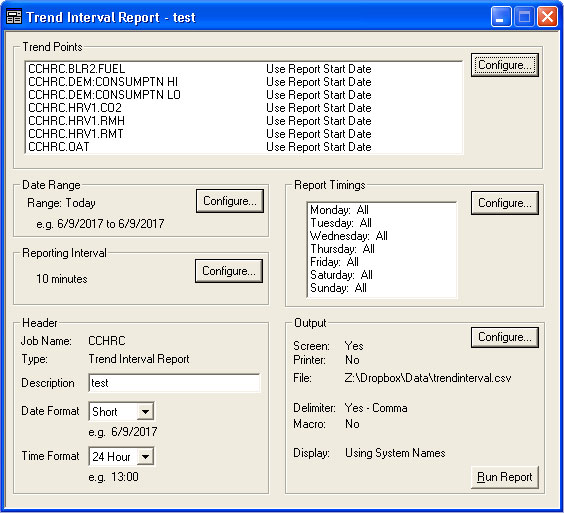
Run the report to verify the information is correct, then select Save As from the Definition menu. This will save your report.
Schedule Automatic Reports
Finally, the system needs to be configured to automatically collect the data from the Siemens field panel by scheduling your reports to run and save the data to a CSV file.
Open the Scheduler

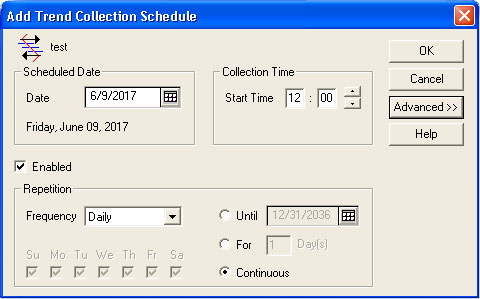
From the Schedule menu select New > Trend Collection
Use the object selector to find the Trend Collection Report you created earlier.
Set up the report to run daily. If you want reports to be generated more often you’ll need to set up a separate instance run for each time you want to generate a report, for instance, one to run at 12:00PM and another to run at 1:00PM.
Once you’ve scheduled the Trend Collection Report, which only pulls data from the Siemens field panel and stores it, you’ll want to do the same for your Trend Interval Report which compiles the data into a readable format for the BMON system.
From the Schedule menu select New > Trend Collection
Use the object selector to find the Trend Interval Report you created earlier.
Set up the report to run daily. If you want reports to be generated more often you’ll need to set up a separate instance run for each time you want to generate a report, for instance, one to run at 12:00PM and another to run at 1:00PM.
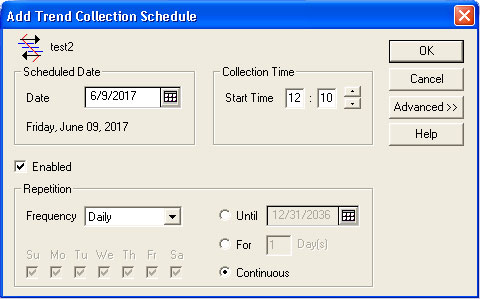
* Note that the Collection Time in this example is set to run 10 minutes after the Trend Collection Report runs, we do this to give the system time to pull the data from the Siemens field panel, only after this is performed can the Trend Interval
Report be generated with current data.