BMON Architecture
BMON is an application that stores sensor data primarily from buildings and provides tools for users to analyze that data. The application is built with the Python Django web framework. Most of the code for the application executes on the web server, although some JavaScript code runs in the user’s browser to update the user interface and make data requests to the server. The JavaScript code is actually written in Coffeescript and then compiled into Javascript. Charts and dashboard graphs utilize the open source Plotly charting library.
The diagram below shows the overall structure of the application.
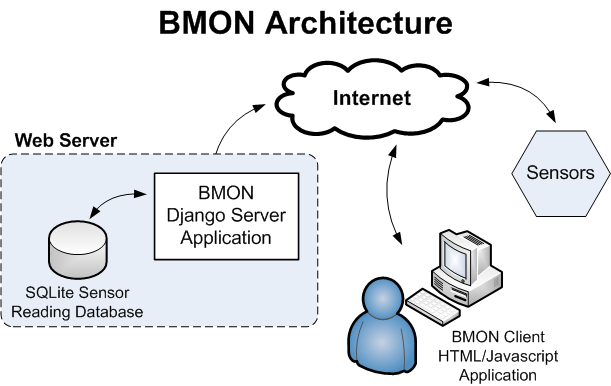
Sensors such as Monnit Wireless Sensors post data across the Internet to the BMON Django application located on the web server. The sensor readings are stored in a SQLite database dedicated to those readings. The Django application utilizes a separate database to store other objects needed by the BMON system, such as building information, sensor descriptions, alert conditions, etc. This database is the standard Django database that is generated from the Models in the Django application.
The User interacts with the BMON application through a web browser. The Django server app supplies HTML documents and associated JavaScript to the user’s browser. The browser application issues AJAX requests back to the server to supply data to the charts and reports used to analyze the sensor data. As well as viewing and analyzing sensor data, a user can log into the BMON application through the Django Admin interface and configure the application. Adding buildings, sensors, alert conditions, etc. is done through the Admin interface.
Details on Django Server Application
This section presents some further details on the Django Server
application. In Django vocabulary, the BMON Django Project consists of
one
application,
the bmsapp application. Thus, the important code files for the
application are found in the bmon/bmsapp directory. Here is a list
of the directories contained in the bmsapp application:
.                   : Main directory with Django models.py, views.py, urls.py files
├── calcs           : Modules to create calculated sensor readings, and to transform sensor values
│   └── metar       : Library to parse National Weather Service METAR formatted data
├── fixtures        : Initial values to store in the main Django database
├── logs            : Log files that are generated by the app are stored here
├── migrations      : Django database migration files
├── periodic_scripts: Scripts that the Sys Admin can select to run periodically
├── readingdb       : All code and data for the Sensor Reading Database
│   └── data        : Sensor Reading Database is stored here
│       └── bak     : Backups of the Sensor Reading Database stored here.
├── reports         : Modules used to produce each BMON chart/report type
├── scripts         : Modules used with the main Cron job that runs every 1/2 hour
│   └── files       : Miscellaneous files related to the scripts.
├── static          : All static content for the app
│   └── bmsapp
│       ├── css     : CSS style sheets
│       ├── images  : Image files
│       └── scripts : JavaScript and CoffeeScript files
└── templates
    └── bmsapp      : Django Template files
The following sections describe some of the key modules used by the application.
views.py Module (root bmsapp directory)
As is the convention in Django, the views.py module provides functions that are accessed by HTTP requests; the urls.py module maps URLs to these functions.
Some of the important functions in the views.py module are:
For Storing Sensor Readings
store_reading(): Stores one sensor reading in the sensor reading database.
store_readings(): Stores multiple sensor readings in the sensor reading database.
For Providing Content to the Browser Application
reports(): Returns the main Reports page which is used to configure and view all of the charts and reports provided by the BMON application. The Django template used to create the page is the reports.html template.
get_report_results(): The Reports page in the browser is a Single Page Application. When the User makes a change to the input controls on the page that affects the report or chart, this function is called by the browser to request the new report or chart content. More explanation of the data format returned is provided later in this document.
bldg_list(): Returns a list of buildings to display to the user for selection.
chart_sensor_list(): Returns a list of charts/reports and a list of sensors that are appropriate for the current building selected by the user.
Sensor Reading Database
All interactions with the Sensor Reading Database occur through the
BMSdata class located in the bmsdata.py module. The class
contains methods for storage of sensor readings, retrieval of sensor
readings, and database backup operations. For an installed BMON system,
the first sensor reading database operation will cause the creation of
the SQLite database, which will be stored in the
bmon/bmsapp/readingdb/data directory. When the
BMSdata.backup_db() method is called, the backup files of the SQLite
database are placed in the bmon/bmsapp/readingdb/data/bak directory;
backup files older than a certain number of days (a method parameter)
are deleted when a new backup file is stored.
To use a different database technology, the only part of the BMON
application that would need to be changed is the bmsdata.py module,
as all access to the database occurs through that module.
Report/Chart Creation
Each report or chart type provided by BMON is mapped to a Python class
located in the bmon/bmsapp/reports directory that generates the
report or chart. In the basechart.py file, you can see how
each single building chart is mapped to a particular class that is used to render the chart:
# These are the possible chart types currently implemented, in the order they will be
# presented to the User.
BLDG_CHART_TYPES = [
    BldgChartType(0, 'Dashboard', 'dashboard.Dashboard'),
    BldgChartType(1, 'Current Sensor Values', 'currentvalues.CurrentValues'),
    BldgChartType(2, 'Plot Sensor Values over Time', 'timeseries.TimeSeries'),
    BldgChartType(3, 'Hourly Profile of a Sensor', 'hourlyprofile.HourlyProfile'),
    BldgChartType(4, 'Histogram of a Sensor', 'histogram.Histogram'),
    BldgChartType(5, 'Sensor X vs Y Scatter Plot', 'xyplot.XYplot'),
    BldgChartType(6, 'Download Sensor Data to Excel', 'exportdata.ExportData')
]
The last constructor parameter for BldgChartType gives the class that is
used to create the chart. For example, the Histogram chart is created by
the Histogram class located in the
histogram module.
For charts/reports that present data from multiple buildings, the
mapping from chart type to class occurs in the models.py
file, in the definition of the
MultiBuildingChart class:
class MultiBuildingChart(models.Model):
    '''
    One particular chart that utilizes data from a group of buildings
    '''

    # descriptive title of the Chart
    title = models.CharField(max_length=60, unique=True)

    MULTI_CHART_CHOICES = (
        ('currentvalues_multi.CurrentValuesMulti', 'Current Sensor Values'),
        ('normalizedbyddbyft2.NormalizedByDDbyFt2', 'Energy / Degree-Day / ft2'),
        ('normalizedbyft2.NormalizedByFt2', 'Energy / ft2'),
    )
... more code
You can see that the Multi-building Current Sensor Values report is
produced by the
currentvalues_multi.CurrentValuesMulti
class. If you wish to create an additional type of multi-building
report, you need to add a new choice in MULTI_CHART_CHOICES and then
create the class that the new report is mapped to in the
bmon/bmsapp/reports directory.
These chart classes all must have a result() method that returns the
report/chart content. This report/chart content is used to fill out the
id="results" HTML div element on the Reports page in the browser.
The return value from the result() function is generally a Python
dictionary with two keys: an html key and an objects key. The
value of the html key is the HTML that is inserted into the
results div on the browser page. The value of the objects key is
a list of two-tuples, one two-tuple for each object that the browser
needs to create. Objects that the BMON client app knows how to create
are Plotly charts and Dashboards. The fist element of the two-tuple is
the object type that the browser should create (plotly or
dashboard), and the second element is a configuration dictionary for
that particular object.
Transforms and Calculated Fields
Transforms are used to convert incoming sensor readings to different units and are described in this document. All code related to transforms is present in this module.
Calculated Fields allow for new sensor readings to be created from mathematical combinations of other readings or from acquisition from the Internet. The general code for creating calculated fields is in this module. The specific calculated field functions are currently found in the calcfuncs01.py module, although other modules could be created to hold specific calculated field functions. A Cron job runs main_cron.py which in turn runs calc_readings.py to control the process of creating calculated fields.
Main Cron Job
BMON utilizes the Linux Cron utility to run a script that performs a number of tasks that are repeated at equal time intervals. (A better design may have been to start a separate thread in BMON to perform this repetitive task.) As shown in the How to Install BMON on a Web Server document, the Cron job entry looks like the following (the directory paths are dependent on your specific install):
*/5 * * * * ~/webapps/bmon_django/bmon/manage.py runscript main_cron > /dev/null 2>&1
This cron job:
creates calculated reading values and stores Internet weather data in the reading database every half hour,
checks for active Alert Conditions every five minutes,
creates a daily status line in the log file indicating how many sensor readings were stored in the database during the past day (viewable by browsing to
<Domain URL>/show_log),creates a backup of the main Django database every day, and
creates a backup of the reading database every three days.
The Cron job executes the main_cron.py script by using the Django Extensions runscript feature. This runscript command allows the scripts to operate within the Django context, having full access to Django models and the settings file, for example.
Details on the Client Web Browser Application
The BMON Django server application delivers content to the BMON web browser application, which consists of HTML and JavaScript. The browser application provides the user interface for users that are viewing and analyzing the sensor data and configuring the BMON application through the Django Admin interface.
For the Alaska Housing Finance Corporation installation of the BMON application, there are three main BMON pages displayed for the data-viewing user (not the Admin user):
A Map page that displays a Google map with clickable dots at the locations of the buildings containing sensors.
The main Charts/Reports page of the application where the user can view and analyze the sensor data.
A Training page with some video tutorials and report information.
The choice of main pages is somewhat configurable through the Django settings file. Here is the section of the settings file that allows configuration and selection of the Default page that will show when a user browses to the base URL for the application:
# Information about the Navigation links that appear at the top of each web page.
#     First item in tuple is Text that will be shown for the link.
#     Second item is the name of the template that will be rendered to produce the page.
#          'reports' is a special name that will cause the main reports/charts page to be
#          rendered.  For other names in this position, there must be a corresponding
#          [template name].html file present in the templates/bmsapp directory.  The custom
#          template cannot match any of the URLs listed in urls.py.
#     The third item (optional) is True if this item should be the default index page for
#         the application.
BMSAPP_NAV_LINKS = ( ('Map', 'map'),
                     ('Data Charts and Reports', 'reports', True),
                     ('Training Videos and Project Reports', 'training_anthc'),
                   )
The main Charts/Reports page is the core of the application. It functions as a Single Page Application. With the initial loading of that page, all of the static HTML of the page and all of HTML Input elements are downloaded from the server. As the user changes inputs, AJAX calls are made to the server to update the contents of various selection inputs (e.g. update the sensor selection dropdown due to a new building being selected) and to update the final chart or report results.
User Interface Configuration based on Chart/Report Type
As discussed before, each type of chart or report has Python class on the server that is responsible for generation of the chart/report. Each one of those classes also contains some configuration properties that control:
which HTML input elements are visible in the browser client for that chart type,
whether multiple sensors can be selected for this chart type,
whether the chart or report should be automatically refreshed when inputs change,
whether an automatic timed refresh of the chart or report should occur every 10 minutes.
In the BaseChart class from which all chart/report classes inherit,
you can see the class properties that control these elements of the
browser interface described above:
class BaseChart(object):
    """Base class for all of the chart classes.
    """

    # Constants to override, if needed for the specific chart being created.
    # These constants affect configuration of the browser user interface that
    # will be used for this particular chart.

    # This is a comma-separated list of the client HTML controls that need to be
    # visible for this chart.
    CTRLS = 'time_period, refresh'

    # 1 if the Sensor selection control should allow for selecting more than one
    # sensor.
    MULTI_SENSOR = 0

    # 1 if the chart should automatically recalculate and refresh when the user
    # changes inputs.
    AUTO_RECALC = 1

    # 1 if the chart should automatically refresh every 10 minutes even without
    # changes in user inputs
    TIMED_REFRESH = 0
These class properties are converted to HTML attributes and sent to the browser client; The main JavaScript file for the browser app reads these attributes and controls the user interface accordingly.
Updating the Main Chart/Report Content
As the user changes inputs in the browser application, the main chart or
report requires updating. When an update is required, the browser makes
a request to the server reports/results/ URL, passing all of the
user’s inputs to the server. The server responds with JSON content
created from the result() method for the particular chart type being
viewed. This content was described above in the Report/Chart Creation
section and consists of an HTML string and list of objects for the
browser to create. Here is the CoffeeScript code in bmsapp.coffee
that requests that content from the server, inserts the HTML in the
results div and then creates the requested browser objects (Plotly
charts and Dashboards.)
# Updates the results portion of the page
update_results = ->
  $("body").css "cursor", "wait"    # show hourglass
  url = "#{$("#BaseURL").text()}reports/results/"
  $.getJSON(url, $("#content select, #content input").serialize()
  ).done((results) ->
    # load the returned HTML into the results div, but empty first to ensure
    # event handlers, etc. are removed
    $("body").css "cursor", "default"   # remove hourglass cursor
    $("#results").empty()
    $("#results").html results.html
    # Loop through the returned JavaScript objects to create and make them
    $.each results.objects, (ix, obj) ->
      [obj_type, obj_config] = obj
      switch obj_type
        when 'plotly' then Plotly.plot(obj_config.renderTo, obj_config.data, obj_config.layout, obj_config.config)
        when 'dashboard' then ANdash.createDashboard(obj_config)
  ).fail (jqxhr, textStatus, error) ->
    $("body").css "cursor", "default"   # remove hourglass cursor
    err = textStatus + ", " + error
    alert "Error Occurred: " + err
If an object is a ‘dashboard’, it is created by the CoffeeScript code in the dashboard.coffee file.