Custom Reports
Custom Reports give you the ability to combine any number of BMON charts and reports together into a single page, and gives you the ability to add explanatory text and include images and content from other websites.
In the BMON interface, Custom Reports are accessed from the navigation
link in the page header. After clicking the navigation link you’ll be
presented with a list of all the reports that have been configured on
your system. The reports are grouped under headings, and the title of
each report is a clickable link that takes you to the report page.
To create a Custom Report, log into the Admin interface and navigate to the screen that allows you to edit or configure Custom Reports:
Go to the main Home screen for the Admin Interface by clicking the
Homelink in the upper left corner of your current screen.Click the
Custom reportslink in the left column of the Home screen.
Once in the Custom Reports section of the Admin interface, you will
see the list of Custom Reports that have already been entered into the
system. If the system is new, none will be shown. Click the
ADD CUSTOM REPORT button to add a new report.
Here are the inputs for entering a new Custom Report:
Group: The name of the group header that you want this report to appear under in the list of custom reports. In the list, the groups are sorted alphebetically, but if you want them to appear in a different order you can prefix the group names with numbers (ex. 1 - First Group, 2 - Another Group).
Title: The name of this report as you want it to appear in the list.
Sort Order: A Sort order for this report, which can be used to order the report appears in the list of Custom Reports. Reports with lower
Sort Ordernumbers will appear higher on the list. Leaving space between your Sort order values (e.g. 10, 20, 30, etc.) makes sense so a future report can be fit in between existing reports. If the order of the reports in unimportant you can leave the default value.Report Content: This is where you define the content that will appear in the report. It allows for text, embedded BMON charts and reports, images, links, and other additional content to be entered using Markdown syntax.
There are many great resources online for learning to use Markdown syntax, including this tutorial. There is more information on adding links and images under the BMON documentation for Add Buildings and Sensors.
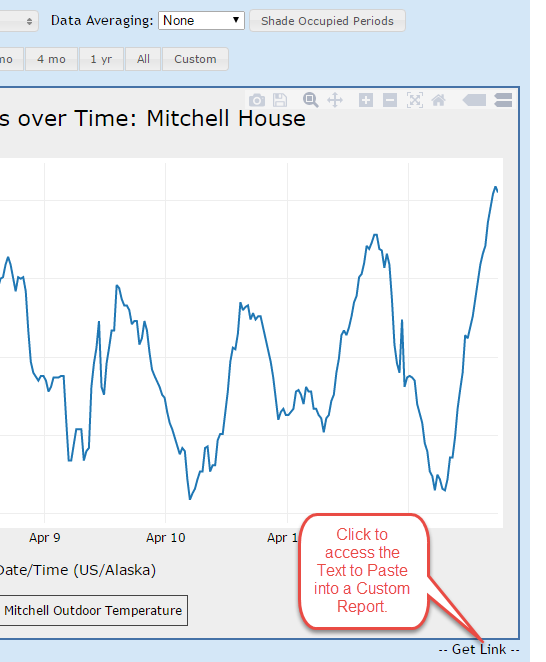
The easiest way to embed a BMON chart, report, or dashboard is to
navigate to the chart on your BMON system (in the regular interface, not
the Admin interface), and to click the -- Get Link -- link that is
below the bottom right corner of the chart. Here is an example of where
the – Get Link – option appears:
Clicking the link will bring up a dialog that shows the text that you
need to include in the custom report to embed the chart. Click the
Copy to Clipboard button and then paste (Ctrl+V) the text into the
Report Content for the Custom Report that you are building. The text
will look something like this:
<!--- Embedded BMON Chart: Plot Sensor Values over Time --->
<script src="/reports/embed/?select_group=0&select_bldg=2&select_chart=2&select_sensor=37&averaging_time=0&time_period=7" style="width: 930px" async></script>
The text on the first line, between <!--- and ---> is just a
label to help you keep track of what you’ve embedded. Feel free to edit
that portion to create a more meaningful label.
The text inside the <script> tag is HTML code that describes the
report that is embedded and if you make changes it is possible that the
chart won’t render correctly. But, if you are familiar with HTML, you
can use the style attribute to control the size or appearance of the
embedded chart.
Note: Web developers can also use this link to embed BMON charts and reports in external web pages, but you’ll have to edit the
srcattribute in the HTML text to use the full url to your BMON site.