System Performance with High Loading
This task involved investigation of how the building monitoring application will perform as the number of buildings, sensors, and historical readings grows. In order to estimate the performance of the system under heavy loading, a simulation of 100 buildings and 20 sensors per building was performed. The sensors were simulated as posting data every 10 minutes. The simulation started with 10 years of historical data in the sensor reading database, which resulted in a sensor reading database of 20 GB in size. For comparison, the current AHFC building monitoring database is 0.14 GB in size, so the simulated database is about 140 times larger.
The web server configuration used in this test was similar to the configuration used currently to host both the AHFC and ANTHC monitoring web sites. More details are provided on this configuration in a subsequent portion of this document.
There are two questions of interest:
Does the system respond quickly enough to the users who are viewing the collected data?
Will the system accept the rate of sensor readings being posted from the buildings?
Before presenting the details of the analysis, here are the conclusions:
When viewing and analyzing data on the above-described large system, users will experience very little reduction in the response time of the charts and reports generated by the system as compared to current response time on the AHFC system. Relative to the current AHFC monitoring site, we measured a 0.06 second reduction in response time on the simulated large site.
We estimate that 100 buildings as described above will post approximately 2.5 - 5.0 sensor readings per second. When we simulated the large system, the web application successfully accepted sensor posting rates of 25 readings per second, 5 to 10 times more than than needed to support a system with 100 buildings. Furthermore, the acceptance of 25 readings per second occurred under a very heavy user load in terms of chart and report queries. Under light query loading, the site accepted approximately 35 sensor reading posts per second.
Our analysis indicates that the monitoring web application with its existing configuration would support well over 100 buildings with 20 sensors in each building. However, a system larger than 100 buildings is probably not practical from a usability perspective, as selecting individual buildings would become cumbersome. Considering that additional monitoring web sites can be deployed for a cost of about $8.50/month, there is probably no need to allow one monitoring application grow to such a large size. Also, 10 years of data is more than adequate for analyzing energy trends. If a system grows beyond that size, older data can be removed and archived as explained in Backing Up and Analyzing Data from the System.
Detailed Simulation Results
The graph below presents the important data collected in the performance simulation. This graph shows the results of simulating the large 100 building system described above.
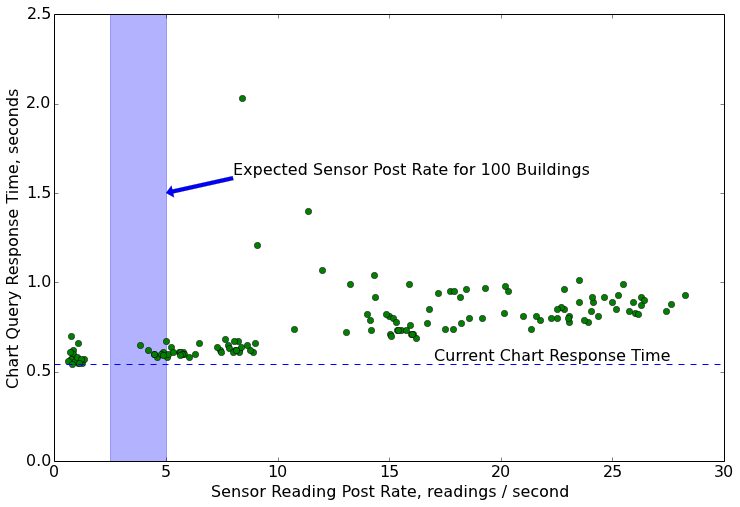
The vertical axis of the graph shows the amount of time required to return the data necessary for the test chart, which is a chart that graphs three sensors across one year, averaging values into weekly intervals. The test configuration attempts to reduce the impact of the data transmission speed between the user and server, since the important parameters being measured in this simulation are related to server performance, not network speed. The units of the vertical axis are the average time required by the server to respond to this request in seconds.
The horizontal axis of the graph shows the current load on the server due to sensor readings being posted to the database. The units are sensor readings posted to the database per second.
Each point on the graph represents the results from one test. To perform the test, the simulation system started posting sensor readings to the database at a particular rate. Then, the test chart was requested from the server. The chart was requested 10 times, and response time of the server was averaged across those 10 requests. The graph plots the average response time for the chart request against the measured sensor posting rate that occurred. The simulation system was programmed to pause for 25 seconds and then repeat the test, generating a new point on the plot. The test continued for multiple hours.
The sensor reading posting rate was varied across these various tests to determine how much the chart response time was affected by the rate of sensor readings flowing into the server. As the chart shows, response time does slow down (the time becomes larger) as the sensor posting rate becomes larger. However, even at relatively high posting rates of 25 readings per second, the response time averages about 0.8 seconds, only about 0.26 seconds slower than the response times on the current AHFC system. This current response time is indicated on the graph at the horizontal dashed line.
The vertical shaded band on the graph shows the expected sensor posting rate from a system that consists of 100 buildings. The response time that occurs when the posting rate is within this range is just slightly above the current response time of the AHFC monitoring system, indicating that little impact should be noticed as the current system grows. The graph also shows that the monitoring system is able to accept much higher sensor posting rates than those expected from 100 buildings.
The graph shows a few outlier points where the response time substantially exceeds normal values. This test is conducted on a web server that is shared across many users. So, activities on the sites of those users and activities by the administrator of the server probably explains these anomalies.
The sensor reading database used in this simulation was 20 GB in size. The monitoring system is currently configured to back up this database every 3 days. When the database is this large, the backup process takes approximately 12 minutes. During this time, readings from devices such as Monnit wireless sensors and the AHFC DDC building control system will be lost. Readings from the Mini-Monitor systems in the 3-8 plex public housing buildings will not be lost, because the Mini-Monitor system queues up failed readings and tries to send them at a later time.
Web Server Configuration
To perform this simulation, a new standard web hosting account was set up on the Webfaction hosting service. This service and this type of account are the ones that are currently being used for the AHFC monitoring system and the ANTHC monitoring system. The service is a “shared” hosting service, whereby multiple web sites are hosted on one physical server. The hosting company monitors the server to ensure that loads are not excessive due to the multiple users. This standard account on Webfaction costs $8.50/month when paid for on an annual basis. Current characteristics of the account for each user are:
100 GB Storage space
512 MB Application Memory
These values have increased over time without an associated price increase. The CPUs on one server are quad-core 3.4 GHz Intel Xeon processors. The Linux-reported load values while this simulation occurred averaged about 2.6, a value typical for Webfaction servers.
Chart queries and sensor reading posts were executed from a separate server in the same server farm. By using a neighboring machine, data transmission times were minimal causing the experiment to measure server performance, not network performance.
Methods for Increasing Performance
The results of this simulation indicate little need for increased
performance. However, should additional performance be needed due to
unforeseen circumstances or due to a shortcoming of this simulation, the
next step would be to move the sensor reading database to a more capable
database platform. Amazon, Google and others provide high power database
services that could be utilized for storing sensor readings. The rest of
the web server application could remain on Webfaction, but the sensor
database would be moved to the more capable server. There is one code
module,
bmsapp/readingdb/bmsdata.py,
that holds the routines to store and retrieve data from the database.
The code in this module would need to be altered to access the new
database system. Because the code already uses the standard SQL database
language, code modifications should be minimal. It would also be helpful
to move the code that accepts sensor readings and stores them in the
database to the machine holding the database. The relevant functions
that would need relocation are bmsapp/views.store_reading() and
bmsapp/views.store_readings() and the bmsapp.storereads.py
module.